

August Update
August 2025 delivered a broadly positive month for global equities, underpinned by a stronger-than-expected corporate earnings season. Yet for Australian investors, the story was defined less by earnings beats and more by currency headwinds. The S&P 500 rose 1.91% in U.S. dollar terms, but sustained USD strength reduced that gain to just 0.15% when translated into Australian dollars—demonstrating how foreign exchange moves can materially dilute offshore equity returns. In contrast, the S&P/ASX 200 delivered its strongest August in 16 years, supported by robust domestic conditions and the RBA’s 25 bps rate cut to 3.60% on August 12. NVIDIA’s Q2 results stood out globally, reaffirming its leadership in the AI cycle with revenue and EPS comfortably above consensus. However, despite the bullish earnings backdrop, caution was evident in derivatives markets. The put skew on the Invesco QQQ Trust (QQQ) widened sharply, with the put/call ratio jumping to 1.7, highlighting that institutional investors were actively hedging against downside risk even as indices moved higher.
NVIDIA Earnings Reaffirm AI Leadership Amid Surging Data Center Demand

NVIDIA’s Q2 FY2026 earnings, released on August 27, 2025, once again underscored its central role in the AI-driven advanced computing cycle. Revenue hit $46.74 billion (vs. $46.06 billion expected) and adjusted EPS came in at $1.05 (vs. $1.01 estimated), with GAAP EPS at $1.08. Management guided for Q3 revenue of $54 billion (±2%), topping expectations of $53.1 billion, though excluding any contribution from China due to ongoing export restrictions.
The data center division delivered $41.1 billion in revenue, up 56% year-on-year but slightly below estimates. GPU compute sales softened sequentially without China, but networking nearly doubled, highlighting NVIDIA’s expanding systems footprint. CFO Colette Kress noted that $3–4 trillion in AI infrastructure spend is expected by decade’s end, framing the company’s growth within a massive secular investment cycle.
While NVIDIA’s gaming and robotics units showed strong growth, the story remains squarely about AI infrastructure. The results affirm that semiconductors sit at the heart of advanced computing, powering hyperscaler investment in generative AI. Yet risks remain: margins compressed, China remains sidelined, and competition is intensifying. NVIDIA is still the clearest beneficiary of the AI boom, but its trajectory is bound to both technology demand and geopolitics.
Q2 Earnings Scorecard
Source: FactSet
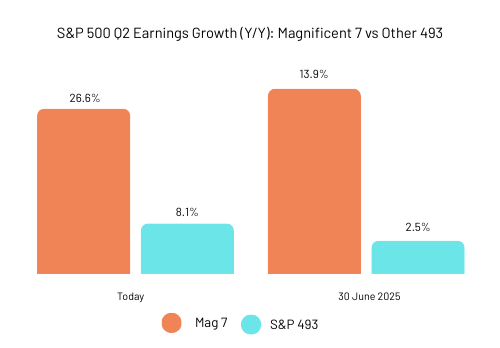
For Q2 2025, with 98% of S&P 500 companies having reported results, 81% exceeded EPS expectations, and 81% surpassed revenue estimates. With NVIDIA’s Q2 results released on August 27, all members of the “Magnificent 7” have now reported their second-quarter earnings and all seven companies (100%) delivered a positive EPS surprise, outperforming the 81% rate for the broader S&P 500. Collectively, the group beat estimates by 10.5%, compared with 7.7% for all S&P 500 companies.
The “Magnificent 7” posted aggregate earnings growth of 26.6% for Q2, slightly below their four-quarter average of 31.0%. Notably, four members including NVIDIA, Amazon, Meta , and Microsoft, all ranked among the top six contributors to S&P 500 earnings growth for the quarter.
The Put Skew
A striking shift is occurring in market sentiment as traders increasingly buy "disaster insurance" for the market. This trend is visible in the options market for the Invesco QQQ Trust (QQQ), the famous ETF tracking the Nasdaq.
The cost of insuring against a wide correction versus a normal correction has surged to levels not seen since 2021. This phenomenon is known as the put skew, and it measures the disproportionately high cost of put options for downside protection compared to call options for an upside rally. A steep put skew can indicate that institutional investors and large fund managers are actively hedging their portfolios, creating a strong demand for these options, and this is exactly what we’re seeing right now.
You can clearly see this dynamic reflected in the Volatility Skew chart for the Nasdaq-100 (NDX). This chart essentially shows the "price" of options across different potential market movements. Notice how the line slopes upwards as you move to the left side of the chart, representing lower strike prices (a market pullback). This visually confirms that the implied volatility, which is essentially the underlying price of the "disaster insurance" (put options), is significantly higher for a potential market drop. In simpler terms, the market is making it much more expensive to protect against a decline than to bet on a rally.
The data backs this up. The put/call ratio, a widely used tool for gauging sentiment, shows a significant and accelerating trend toward fear. Think of the put/call ratio as a barometer of fear and greed.
A low ratio (less than 1, Calls > Puts) means traders are greedy, betting on a rising market.
A high ratio (more than 1, Puts > Calls) means traders are fearful, buying protection against a market drop.
QQQ's Put/Call Ratio based on open interest has surged. As of August 29, it increased by 6.3% in just five days to a reading of 1.7. This is a very high number, revealing a significant imbalance where there are 1.7 put contracts for every 1 call contract. This rapid increase is a strong signal that fear is building and traders are growing more convinced that the market is more likely to fall than rise.

Source: OptionCharts
RBA Cuts Rates
The Reserve Bank of Australia was a key driver of market activity in August with its decision on August 12 to cut the official cash rate by 25 basis points to 3.60%. This was a widely anticipated move, representing the third rate cut this year, and was seen as a continuation of the RBA's strategy to bring inflation down while avoiding a sharp rise in unemployment. From a market pricing perspective, the cut had a notable impact on the Australian dollar. While the RBA's dovish pivot supported the domestic market, it also put downward pressure on the currency