

May Update
The Bears are still licking their wounds from a near 20% equity rally since early-April. For the month, the S&P 500 soared 6.15% (14th best month in a decade) and the Nasdaq-100 +9.04% (10th best).
The "Sell in May and go away" adage, which advises avoiding stocks during the U.S. summer months, has been challenged. Data from the S&P 500 over the 20 years from 2005 to 2024 shows a modest difference of about 0.5% in average monthly returns between the six months before and after May—November to April averaged 1.02% per month (6.12% total), while May to October averaged 0.49% per month (2.94% total). While market trends for the rest of the year remain uncertain.
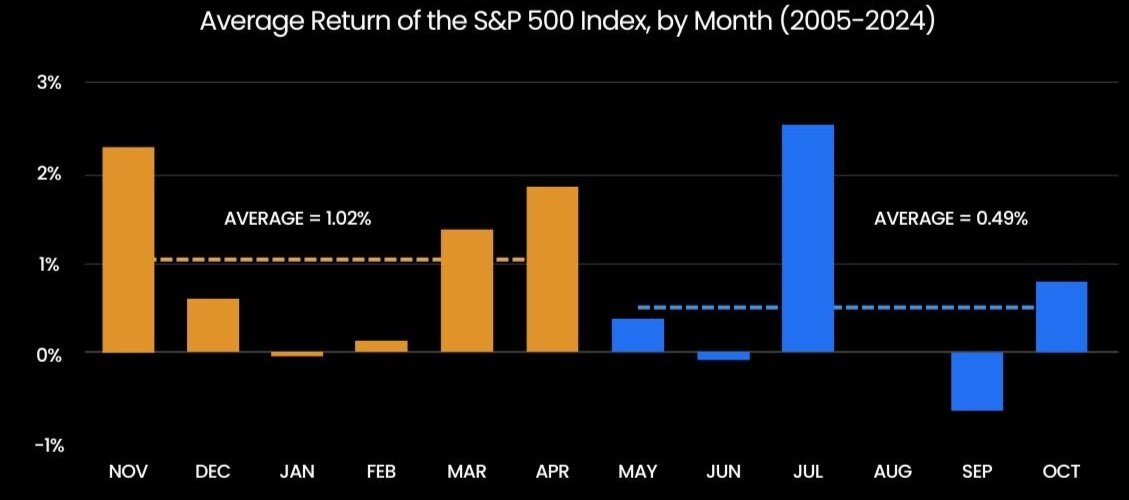
Source: Charts.com, march 30, 2025
A Sigh of Relief on TTT - Trump Tariff Tantrums
The US secured temporary trade pauses with China, the EU, and the UK, easing global economic tensions. On May 12, a 90-day US-China agreement reduced U.S. tariffs on Chinese imports from 145% to 30% (comprising a 10% baseline tariff and a 20% fentanyl-related duty) and Chinese tariffs on U.S. goods from 125% to 10%. On May 15, a US-EU pause maintained 15% tariffs but halted new aerospace and agricultural levies. On May 18, a US-UK agreement kept 10% tariffs on most UK goods but removed them on vehicles, steel, and aluminum, driving gains for US automakers and supporting farmers.
Yields Rising - Less Rate Cuts
US Treasury yields rose, particularly at the long end, driven by trade policy uncertainty and inflation expectations, though the US-China trade truce tempered these pressures. The Fed maintained rates at 4.25%–4.5%, with markets scaling back rate cut expectations from 4–5 to 2–3 for the year, likely starting in July or September. The truce reduced immediate inflation fears, giving the Fed breathing room, but lingering tariff uncertainties and a resilient labor market kept policymakers cautious, shaping a complex outlook for yields and monetary policy.
Solid U.S. Earnings
At the end of May, 98% of S&P 500 companies reported quarterly earnings, with 78% posting positive EPS surprises and 64% exceeding revenue expectations. For Q2 2025, 51 companies issued negative EPS guidance, while 43 were positive. Overall, 98% of the companies in the S&P 500 have reported actual results for Q1 2025 to date. Of these companies, 78% have reported actual EPS above estimates, which is above the 5-year average of 77% and above the 10-year average of 75%. In aggregate, companies are reporting earnings that are 8.2% above estimates, which is below the 5-year average of 8.8% but above the 10-year average of 6.9%. The “Magnificent 7” outperformed, with 86% reporting EPS surprises and a 27.7% growth rate, exceeding estimates by 14.9% but below their prior three-quarter average of 32.1%. Alphabet, Amazon, and NVIDIA were among the top S&P 500 growth contributors. Despite the strong performance in the first quarter, analysts still expect lower earnings growth for the “Magnificent 7” companies over the next four quarters. For Q2 2025 through Q1 2026, analysts are predicting earnings growth rates of 14.0%, 8.9%, 10.6%, and 10.2%, respectively.
S&P 500 Falls Behind Global Markets Most Since 1993
In 2025, the S&P 500 has underperformed global stocks (excluding the US) by 12% year-to-date, marking the largest gap since 1993. This significant divergence, as shown in the chart, reflects a rare period where non-US markets have outpaced the US, a trend last seen at this scale over 30 years ago.

Source: Bloomberg
Japan Debt: A Global Ripple Effect
Japan faces a deepening debt crisis, driven by a shrinking population, 30% of which is over 65 and a birth rate below replacement levels since 1975, alongside economic stagnation following the 1990s asset bubble burst. With a debt-to-GDP ratio exceeding 248%, the highest globally, Japan’s heavy borrowing, sustained by near-zero interest rates and BOJ bond purchases, has fueled the yen carry trade, making Japan the largest foreign holder of U.S. treasuries at $1.138 trillion. However, as the BOJ tightens policy in 2025, rising bond yields and a strengthening yen threaten to unwind these trades, risking global financial instability by potentially increasing U.S. borrowing costs and triggering market volatility.
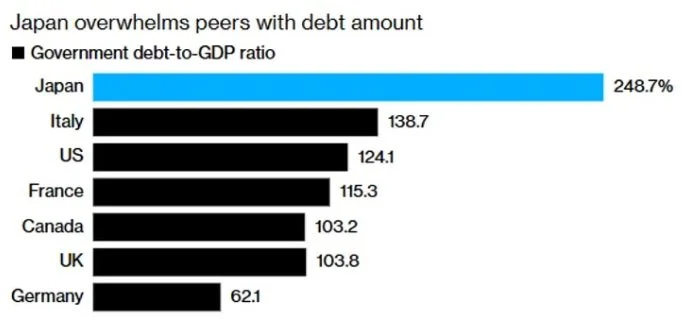
Source: IMF, Bloomberg
Roots of Japan’s Debt Crisis
Japan’s debt crisis emerged in the early 1990s after the asset bubble burst, plunging the country into the “Lost Decades” of economic stagnation and deflation. Between 1985 and 2015, Japan frequently experienced deflation, with annual CPI inflation often dipping below zero despite aggressive interventions. The Bank of Japan (BOJ) slashed interest rates to near-zero and injected liquidity to stimulate the economy, while the government deployed large-scale fiscal stimulus. These efforts failed to restore sustainable inflation, leading to a reliance on borrowing that drove Japan’s debt-to-GDP ratio to 248.7%, far surpassing Italy’s 138.7% and the US’s 124.1%.

Source: Statistics Bureau of Japan
Demographic Pressures and Economic Strain
Japan’s demographic crisis is a key driver of its economic challenges. The country’s births have dropped sharply, declining from around 2 million in the 1970s to under 1 million by 2020, a trend persisting for nine consecutive years. This demographic shift, with 30% of the population now aged 65 or older, has shrunk the workforce since 2008, reducing tax revenues while increasing government spending on healthcare and pensions. The resulting fiscal pressure has forced Japan to borrow heavily, exacerbating its debt burden.

Source: The Ministry of Health, Labour and Welfare & Bloomberg
The BOJ’s Role in Bond Markets
For years, Japan avoided a debt crisis by relying on the BOJ to purchase government bonds, keeping borrowing costs low. As of December 31, 2024, the BOJ held 52.0% of Japan’s government bonds, dwarfing other investors like life insurers (13.4%) and banks (9.8%). This heavy intervention allowed Japan to borrow trillions at near-zero rates, but it also masked the true market value of its bonds, creating a dependency on BOJ support.

Source: Bank of Japan (as of 31 December, 2024)
Global Financial Linkages and the Yen Carry Trade
Japan’s near-zero interest rates fueled the yen carry trade, where investors borrowed yen cheaply to invest in higher-yielding foreign assets. As a result, Japan became the largest foreign holder of U.S. treasuries, with $1,131 billion, ahead of UK’s $765 billion, which just passed China’s $765 billion holding during the month (May). These investments supported global asset prices and kept U.S. interest rates low. However, the BOJ’s 2024 rate hike, the first in decades, caused the yen to surge over 10%, unwinding carry trades and triggering sell-offs in U.S. stocks and other assets, highlighting the systemic risks of Japan’s interconnected financial role.
By 2025, the BOJ’s policy shift has exposed vulnerabilities. Reducing bond purchases has driven Japanese bond yields up top 30-year yields hit 3% and 40-year yields reached 3.6% in May 2025. Declining demand at bond auctions, with the bid-to-cover ratio for 40-year bonds falling to 2.2%, signals eroding investor confidence. If Japan begins selling its U.S. treasuries, the U.S. could face higher interest rates, increasing borrowing costs and adding pressure on the Federal Reserve, while the unwinding yen carry trade threatens global asset prices.
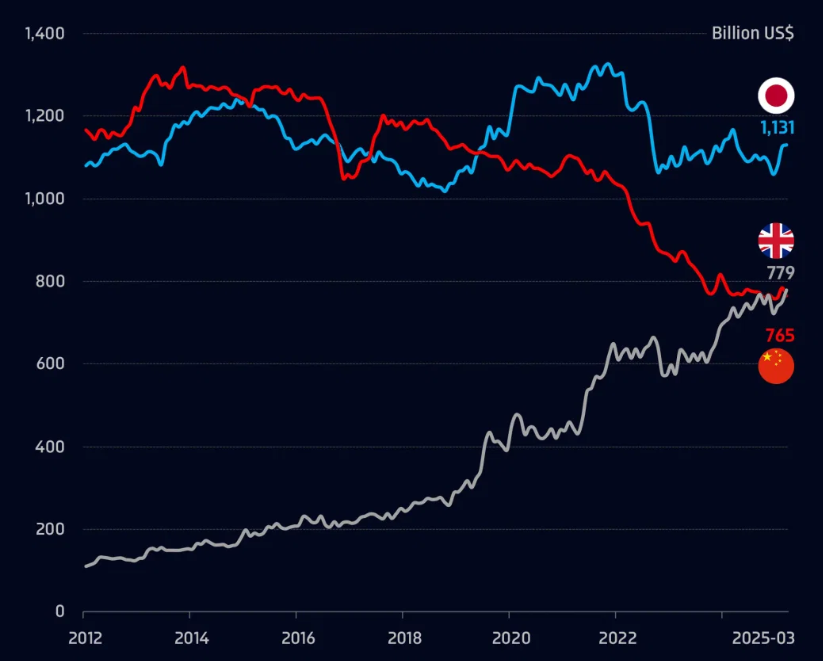
Source: Department of U.S. Treasury
Stock Updates
On Holding (ON) - Lifestyle Brands
On Holding’s Q1 2025 earnings reported net sales of CHF 726.6 million, a 43% year-over-year increase, with a 59.9% gross profit margin. Growth was fueled by a 45.3% rise in direct-to-consumer sales and 41.5% wholesale growth, particularly in APAC and EMEA. Net income dropped 38% to CHF 56.7 million due to increased operating expenses from brand and innovation investments. The company plans a U.S. pricing adjustment for select styles in July 2025, anticipates over 10% same-store growth, and is advancing projects like LightSpray technology while managing costs to support profitability and long-term growth.
Salesforce Inc (CRM) - Software (SaaS), Artificial Intelligence (Agentic AI)
Salesforce’s Q1 FY26 earnings showed $9.33 billion in revenue, up 8% year-over-year but slightly below estimates, with a non-GAAP EPS of $2.44 meeting expectations and a 32.1% operating margin. Subscription and support revenue grew 9%, but weaker bookings from extended deal cycles led to a 6.5% stock drop. Salesforce is focusing on margin expansion, cash flow, and investments in AI, enterprise software, and digital labor. The company is expanding into small and medium-sized businesses and the mid-market, planning to hire 1,000–2,000 salespeople to enhance distribution. Salesforce aims to boost growth in high-performing areas while maintaining margin and cash flow discipline, targeting a multitrillion-dollar market despite macroeconomic challenges.
Nvidia Corp (NVDA) - Semiconductors
NVIDIA’s Q4 FY25 earnings reported $39.33 billion in revenue, up 78% year-over-year, beating estimates of $38.05 billion, with adjusted EPS of $0.89 surpassing forecasts of $0.84. Data center revenue grew 93% to $35.6 billion, driven by Blackwell and Hopper GPUs, with ~50% from large cloud providers. Blackwell, generating $11 billion, is NVIDIA’s fastest-ramping product, shifting focus to AI inference. Net income increased to $22.09 billion from $12.29 billion year-over-year. Despite a 73% gross margin, growth slowed from 262% last year. NVIDIA’s new chips, like Blackwell, are designed for AI inference, moving beyond AI training.
Amazon.com Inc (AMZN) - E-Commerce, Cloud Computing
Amazon’s Q1 FY26 earnings reported $155.67 billion in revenue, exceeding estimates of $155.04 billion (+8.6% YoY), with EPS of $1.59 beating forecasts of $1.36. Net income rose to $17.13 billion from $10.43 billion year-over-year. AWS generated $29.3 billion, up 17% but below $29.42 billion expected, while advertising revenue reached $13.92 billion, up 19%, surpassing $13.74 billion forecasted. Soft Q2 guidance of $159–164 billion in sales and $13–17.5 billion in operating income, below consensus, reflects tariff uncertainties impacting Amazon’s retail unit and third-party sellers reliant on China. CEO Andy Jassy emphasized Amazon’s diverse seller base and cost efficiencies to navigate tariff challenges.
Advanced Micro Devices Inc (AMD) - Semiconductors
AMD’s Q1 FY26 earnings reported $7.44 billion in revenue, beating estimates of $7.13 billion, with adjusted EPS of $0.96 topping forecasts of $0.94. Net income rose to $709 million from $123 million year-over-year. AMD forecasts $7.4 billion in Q2 sales with a 43% gross margin. Data center revenue grew 57% to $3.7 billion, driven by Epyc processors and Instinct GPUs, despite $800 million in costs from U.S. AI chip export controls to China, with $1.5 billion in total lost revenue expected this fiscal year. AMD, the second-largest server CPU vendor behind Intel, is gaining market share with Epyc processors and competes closely with NVIDIA in “big GPUs.” CEO Lisa Su highlighted strong AI demand, with AMD chips powering training and inference for models like OpenAI’s 03, reinforcing its AI and server market position despite tariff uncertainties.
Coupang Inc (CPNG) - Gig Economy (South Korea)
Coupang’s Q1 2025 earnings, showed revenue of $7.91 billion, up 11% year-over-year (21% on a constant currency basis), but fell short of the $8.03 billion expected, while EPS of $0.06 missed forecasts of $0.07. The Product Commerce segment grew 6% (16% in constant currency), driven by Rocket Delivery and Fresh grocery, with Developing Offerings like Coupang Eats and Farfetch surging 67%. Operating income soared 300% to $154 million, and gross profit margin expanded to 29.3%. Despite the misses, Coupang’s robust margin gains and diversified growth signal strength in South Korea’s e-commerce market, though profitability remains a hurdle amid heavy investments.
Shopify Inc (SHOP) - E commerce
Shopify’s Q1 2025 earnings revealed a mixed bag, with revenue climbing 27% year-over-year to $2.36 billion, edging past Wall Street’s expectations, but a net loss of $682 million, or $0.53 per share, widened from $273 million last year, driven by a $900 million equity investment hit. Gross merchandise volume reached $74.75 billion, up 23% but slightly below the $74.8 billion forecast, while subscription solutions revenue hit $620 million, just shy of the $621.5 million expected. Shopify’s focus on higher-income U.S. buyers (over 50% earning above $100,000) and tools like a “buy local” filter helped mitigate tariff exposure, with only 1% of GMV tied to China’s now-closed de minimis exemption. The results highlight Shopify’s revenue strength and platform resilience amid trade uncertainties, though the surprise loss and cautious Q2 profit outlook signal challenges in sustaining profitability.