

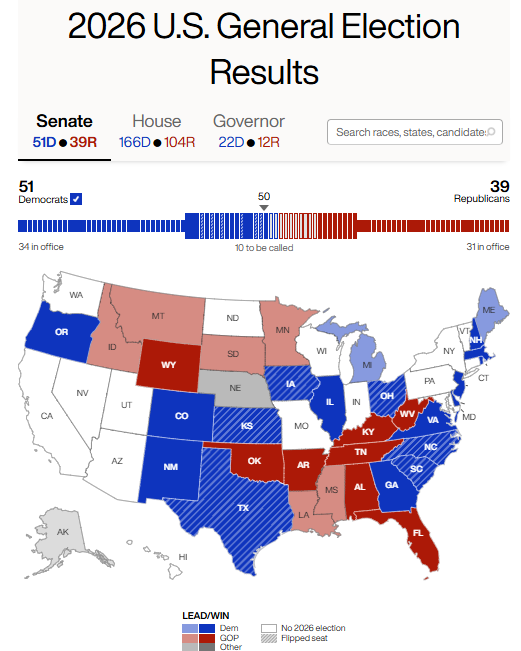
Source: AP Elections, CNBC
The results are still coming through but its clear that the Democrats have secured both the House and the Senate. A sharp rebuke for President Donald Trump. Democrats flipped key Senate seats (including Texas, South Carolina and North Carolina), producing a Democratic Congress under a Republican president. Polymarket had priced roughly a 73% chance of Democrats losing both chambers heading into election day, the scenario the market had treated as most likely was actually a divided government (Red Senate, Blue House). That split has now resolved the other way, and markets are repricing it.
The AI trade is the most sensitive. Greater congressional scrutiny, hearings, and local/state friction around data-centre power, water and permitting are the main transmission channels. Semiconductors and pure-play infrastructure names sit more exposed than the cash-rich hyperscalers or high-quality software. A short, sharp move lower is the base case if the regulation narrative dominates the next few sessions.
Yet the historical record is unambiguous.
Historical Precedent
Average S&P 500 returns in the year after midterms (1962–2022) have been strong across almost every political configuration. The all-period average is 17%. Losing both chambers, the outcome Polymarket had at 73%, has averaged 19%. Retaining the Senate while losing the House has averaged 18%. Only the rare case of losing the Senate while keeping the House has been weak (1%). The data covers every post-midterm calendar year in that window.
Markets: The Real Midterm Winner
Avg S&P 500 return in the year after the midterm, by possible outcome
| Outcome | Avg S&P 500 1-Year Return |
Polymarket Odds | Historical Midterms |
|---|---|---|---|
| All post-midterm years | 17% | — | 15 |
| Lose House and Senate (Most Likely Outcome) |
19% | 73% | 2 |
| Retain Senate, lose House | 18% | 22% | 3 |
| Keep both chambers | 19% | 7% | 4 |
| Lose Senate, keep House | 1% | 1% | 2 |
Source: Bloomberg, S&P 500 calendar year returns after each midterm, 1962 to 2022.
Odds: Polymarket, 3.30pm ET 3 November 2026.
S&P 500 Midterm Streak: Unbroken Since the 1940s
S&P 500 returns from November after each midterm through the following June. Positive in every period since 1942.
| Midterm year | S&P 500 return (Nov–Jun) |
Midterm year | S&P 500 return (Nov–Jun) |
|---|---|---|---|
| 1942 | +32.1% | 1986 | +24.6% |
| 1946 | +2.5% | 1990 | +22.1% |
| 1950 | +7.2% | 1994 | +15.1% |
| 1954 | +29.6% | 1998 | +24.9% |
| 1958 | +13.8% | 2002 | +10.0% |
| 1962 | +22.9% | 2006 | +9.2% |
| 1966 | +13.0% | 2010 | +11.7% |
| 1970 | +18.6% | 2014 | +2.5% |
| 1974 | +28.8% | 2018 | +8.5% |
| 1978 | +10.6% | 2022 | +15.1% |
| 1982 | +25.3% | ||
| Average | +16.6% | Positive periods | 21/21 |
Source: S&P 500 total returns, November after midterm election through the following June. Every period since 1942 has been positive.
A tighter window is even cleaner. From November through the following June after midterms, the S&P 500 has been positive in every single instance since 1942, 21 out of 21 periods, with an average gain of 16.6%.
These figures are calendar-year or Nov–Jun returns after the midterm, not election-night noise. They capture the typical pattern: uncertainty resolves, the binary political event is behind the market, and the third year of a presidential term (historically the strongest of the cycle) begins to assert itself. Technology has historically outperformed in these windows. Looking at Technology (XLK) vs S&P 500 (SPY), over the last 6 mid-term elections, Tech outperformance on a 12-month basis, average return of 20.11% vs 9.17%.
For the AI complex specifically, the near-term risk is real but bounded. Divided government plus presidential veto power limits how much sweeping anti-AI legislation can actually pass. Data-centre permitting and power constraints were already live issues before the election; a Democratic Congress may amplify hearings and local pushback, but the multi-year capex trajectory from the hyperscalers remains the dominant fundamental. JPMorgan’s earlier framing of a roughly 0.5% S&P impact from a blue wave is consistent with a contained reprice rather than a regime change.
The practical takeaway is the classic post-midterm pattern: a possible one-day (or few-day) reprice lower as the outcome is fully digested, followed by a recovery that has been reliable for decades. Since 1942 the S&P 500 has been higher 12 months after every midterm. The average gain in those windows has been in the mid-teens. Buying the uncertainty has worked.
The blue wave changes the political overlay. It does not change the historical seasonality or the underlying AI demand and capital-spending trajectory that has driven the trade.